I feel like I have tunnel vision. We’re so close to being done and I can’t believe it. There’s so many things going on around me and I just have to stay focused on this so I can get it done and out of the way. However, I have been excited about the future, despite the chaos that is swarming around us in the U.S. I am looking forward to new opportunities and I hope all of my classmates are finding the silver-lining in almost being done with the program and having accomplished their goal.
We are going to make it, y’all! #ClassOf2020
Overview of the material and concepts learned this month
Connecting/Synthesizing/Transforming
This month, we focused on using surveys and questionnaires to evaluate our designs and gauge our target audiences response to BoxPark Sushi. As O’Grady and O’Grady (2013) identified “understanding how your practice creates value is essential to growing your business and building better, more profitable relationships” (Ch. 3, para. 5). The best way to showcase these benefits is through clarifying your hard and soft values. The hard values describe the tangible and measurable things your services can do for the client such as saving them time or money on a project using your methods or saving money on materials, etc., while soft values are the emotional connections that the audience may have to the design (O’Grady & O’Grady, 2013).
Carlsson (2019) agreed that by presenting the hard and soft values of design, we are helping businesses to combine science and art to know the unknown. This approach is more humanity-based and allows us to have a more realistic view of a project’s outcome. With this in mind, I created and distributed a questionnaire to my friends on Facebook, Instagram* and Twitter*. As O’Grady and O’Grady (2009) point out, a questionnaire, which is taken online or by paper, helps collect qualitative as well as quantitative results regarding designs.
*My profile on this platform is open to the public
Problem Solving
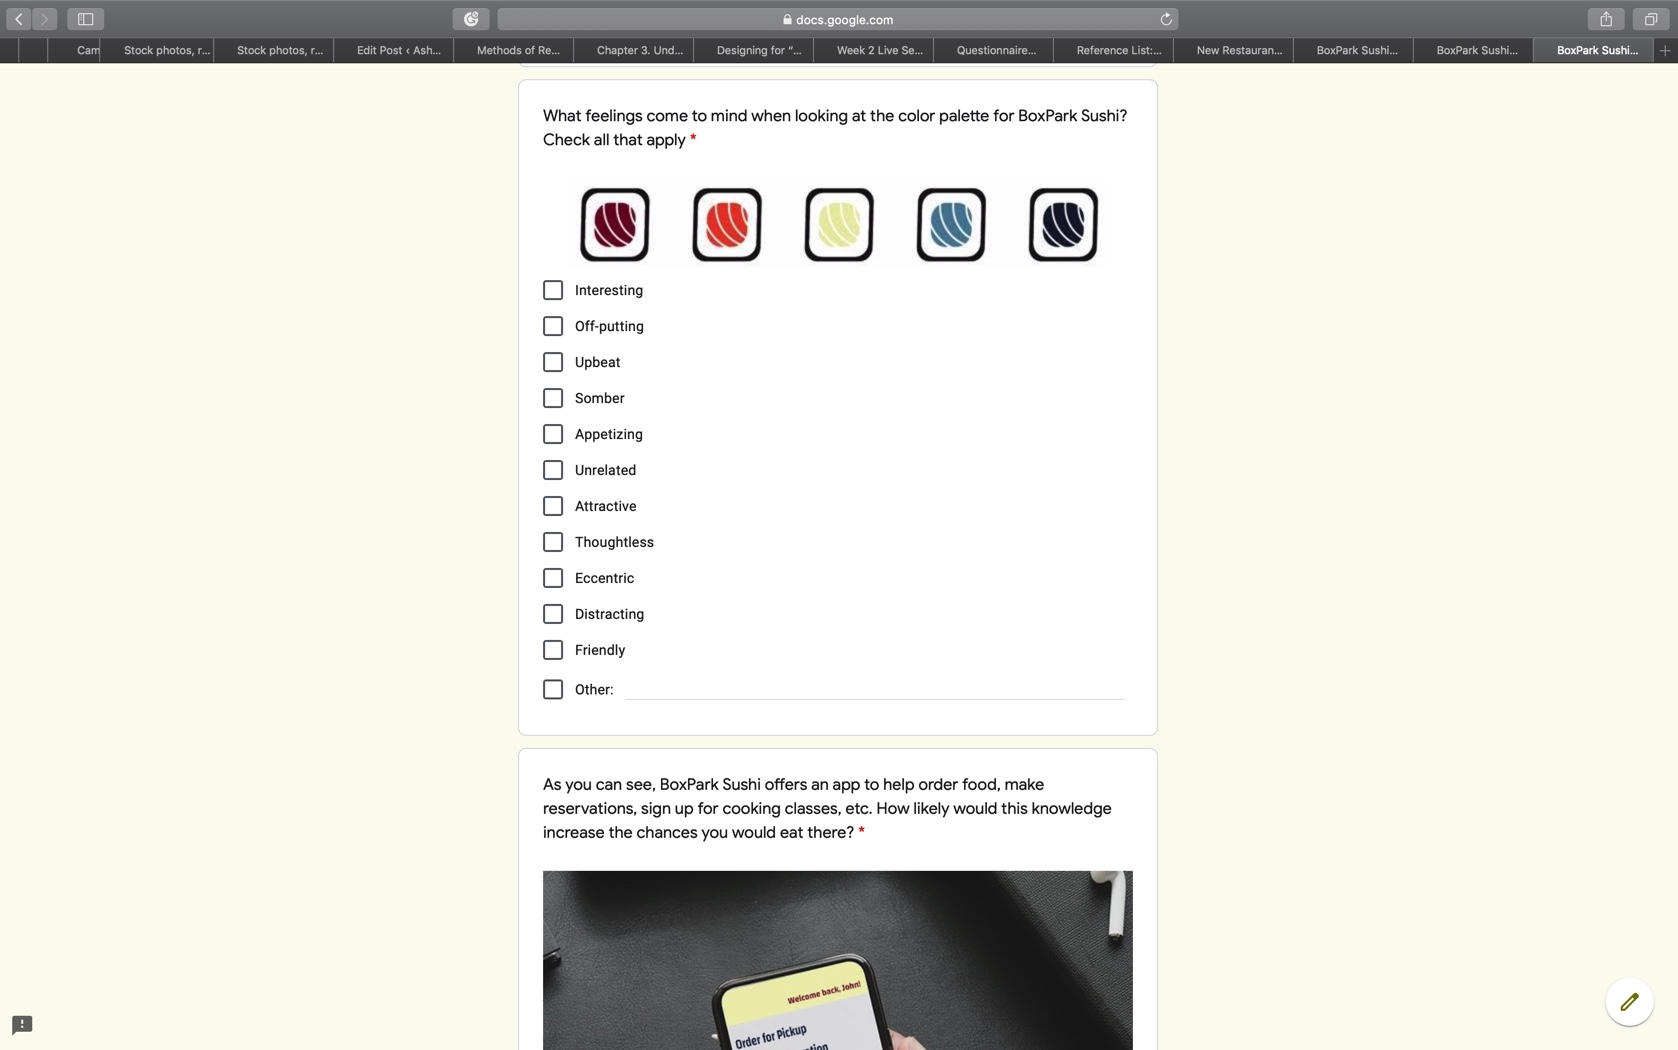
One of the most important and most difficult parts of designing the questionnaire was structuring the questions in a way that would give me the most useful responses. Even with a Bachelors in Psychology and some experience with conducting reserach, it is a whole ‘nother situation trying to evaluate visual designs. As much as I wanted people to say the designs made sense or worked, I wanted to make sure the questions allowed people to say when or how something doesn’t makes sense. O’Grady and O’Grady (2009) stated, that “questions should be written and structured in ways to increase the reliability of valid findings” (para. 2). My goal for the survey was to know if people felt the designs were consistent enough to further brand awareness, especially when it came to the pole banner asset, t-shirt, and mobile app as each of these assets has a design that differs from the logo.
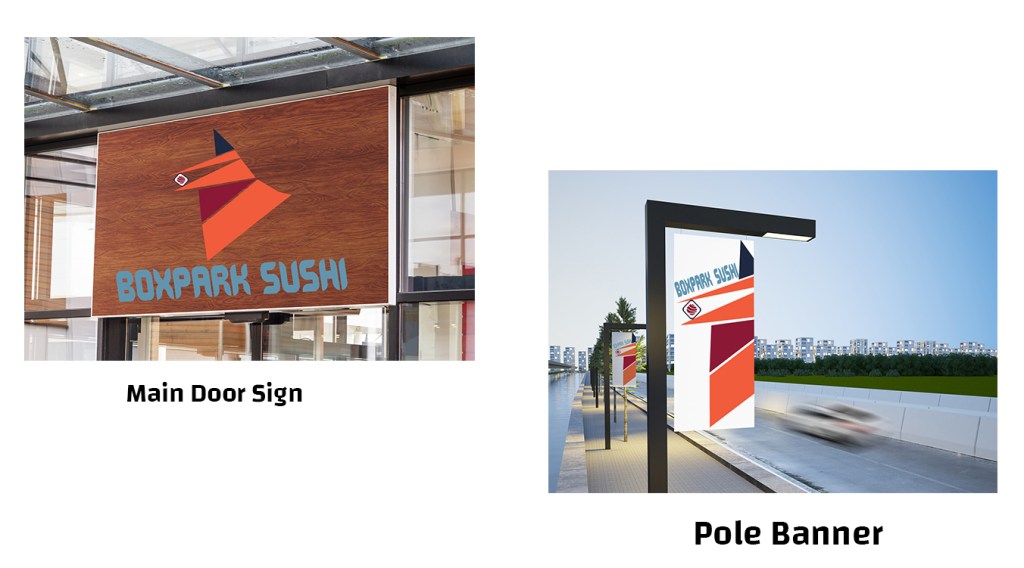
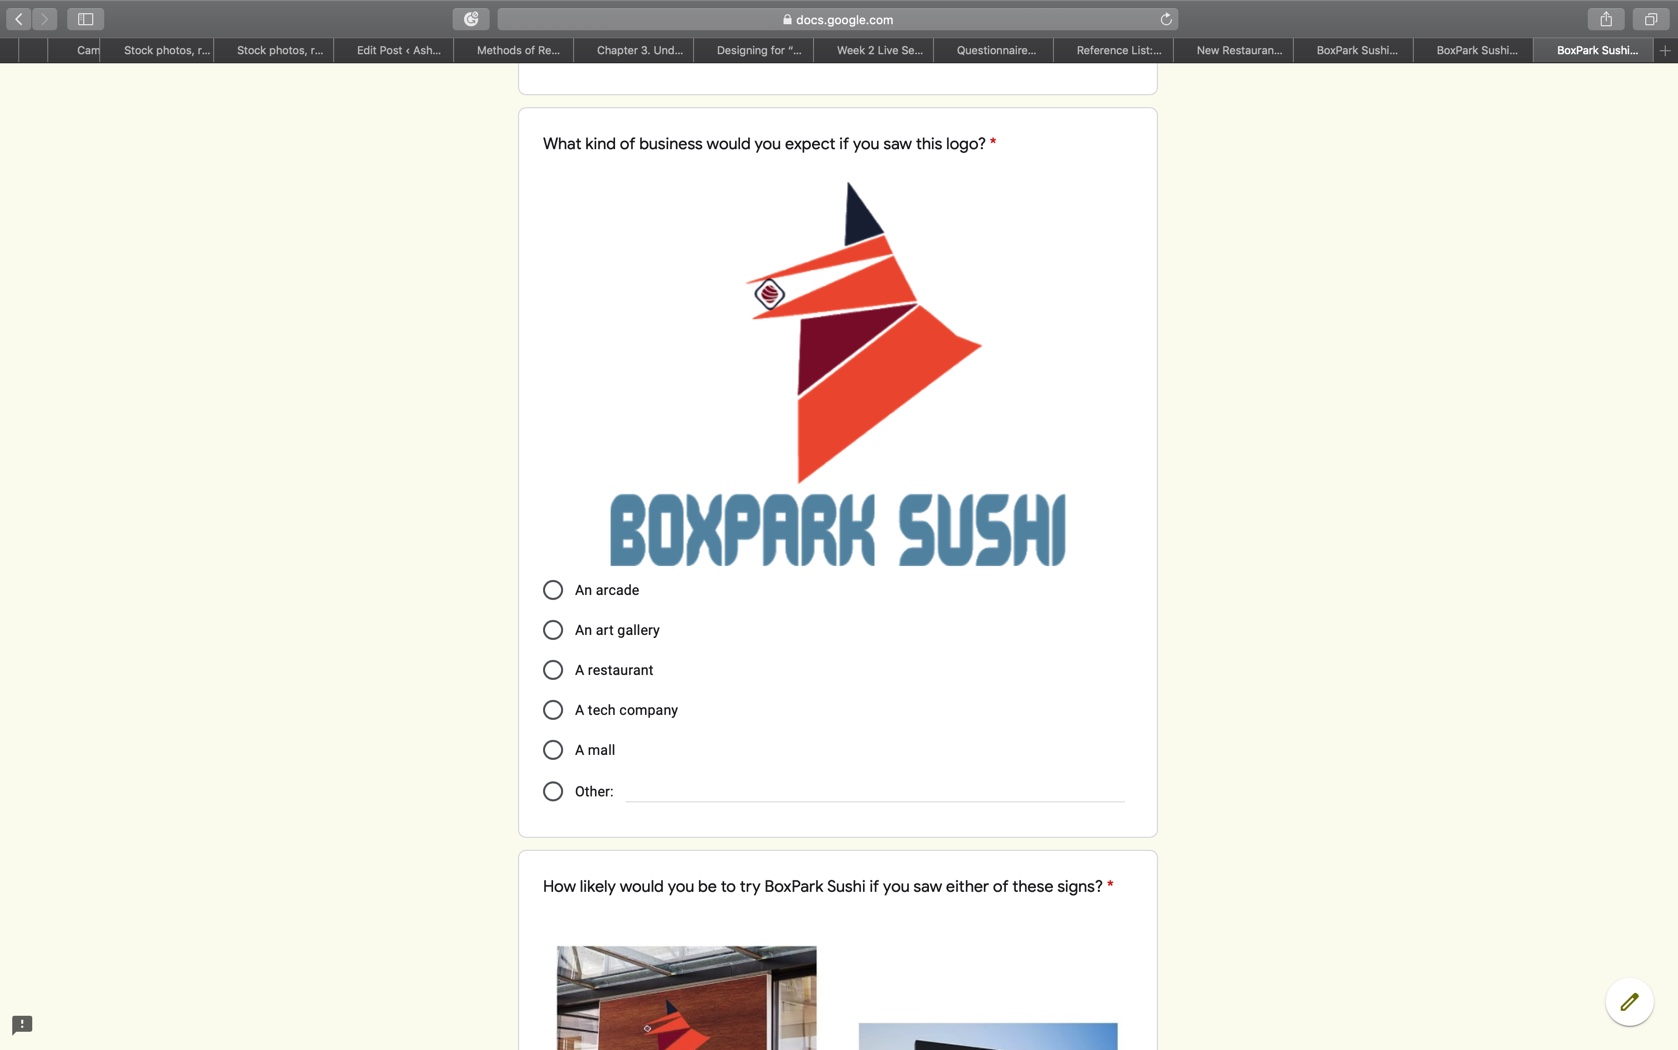
To identify if participants felt these signs were for the same brand, I structured the question (referring to the above image) to ask “Do the designs from the previous question appear to represent the same business?”. The results showed that out of 51 participants, 78.4% of them agreed “Yes” the signs appeared to represent the same business (Coleman, 2020). One participant stated, “I’d probably have a hard time finding thedoor sign since it’s a different color” (Coleman, A, 2020, particpant #23). This information helps understand why they feel the design does not work for them. Having enough insights such as these helps to make decisions about how the brand can best meet its users’ needs (O’Grady & O’Grady, 2009). Structuring my questionnaire to include images with the question, providing access to the brand guide at the top of the questionnaire, and including the link to the brand guide in Question 9 helped ensure participants actually looked at BoxPark Sushi’s visuals and could get a feel for the personality to answer the questions as accurately as possible. While it does not guarantee they took the time to read the whole guide and internalize it, they were still able to get a feel of BoxPark Sushi’s brand with the inclusion of images in the questions and the way the questions were structured.
Innovative Thinking
One of the hard values this questionnaire would have provided for my client is saving money on the cost of testing using Google Forms rather than Survey Monkey. During the survey design, one of the issues I ran into was having to get passed Survey Monkey’s costs for adding images to each question. Although I could have linked my brand guide to the questionnaire, I wanted to ensure that participants actually saw the images and didn’t just try to go through the survey answering questions without looking at anything.
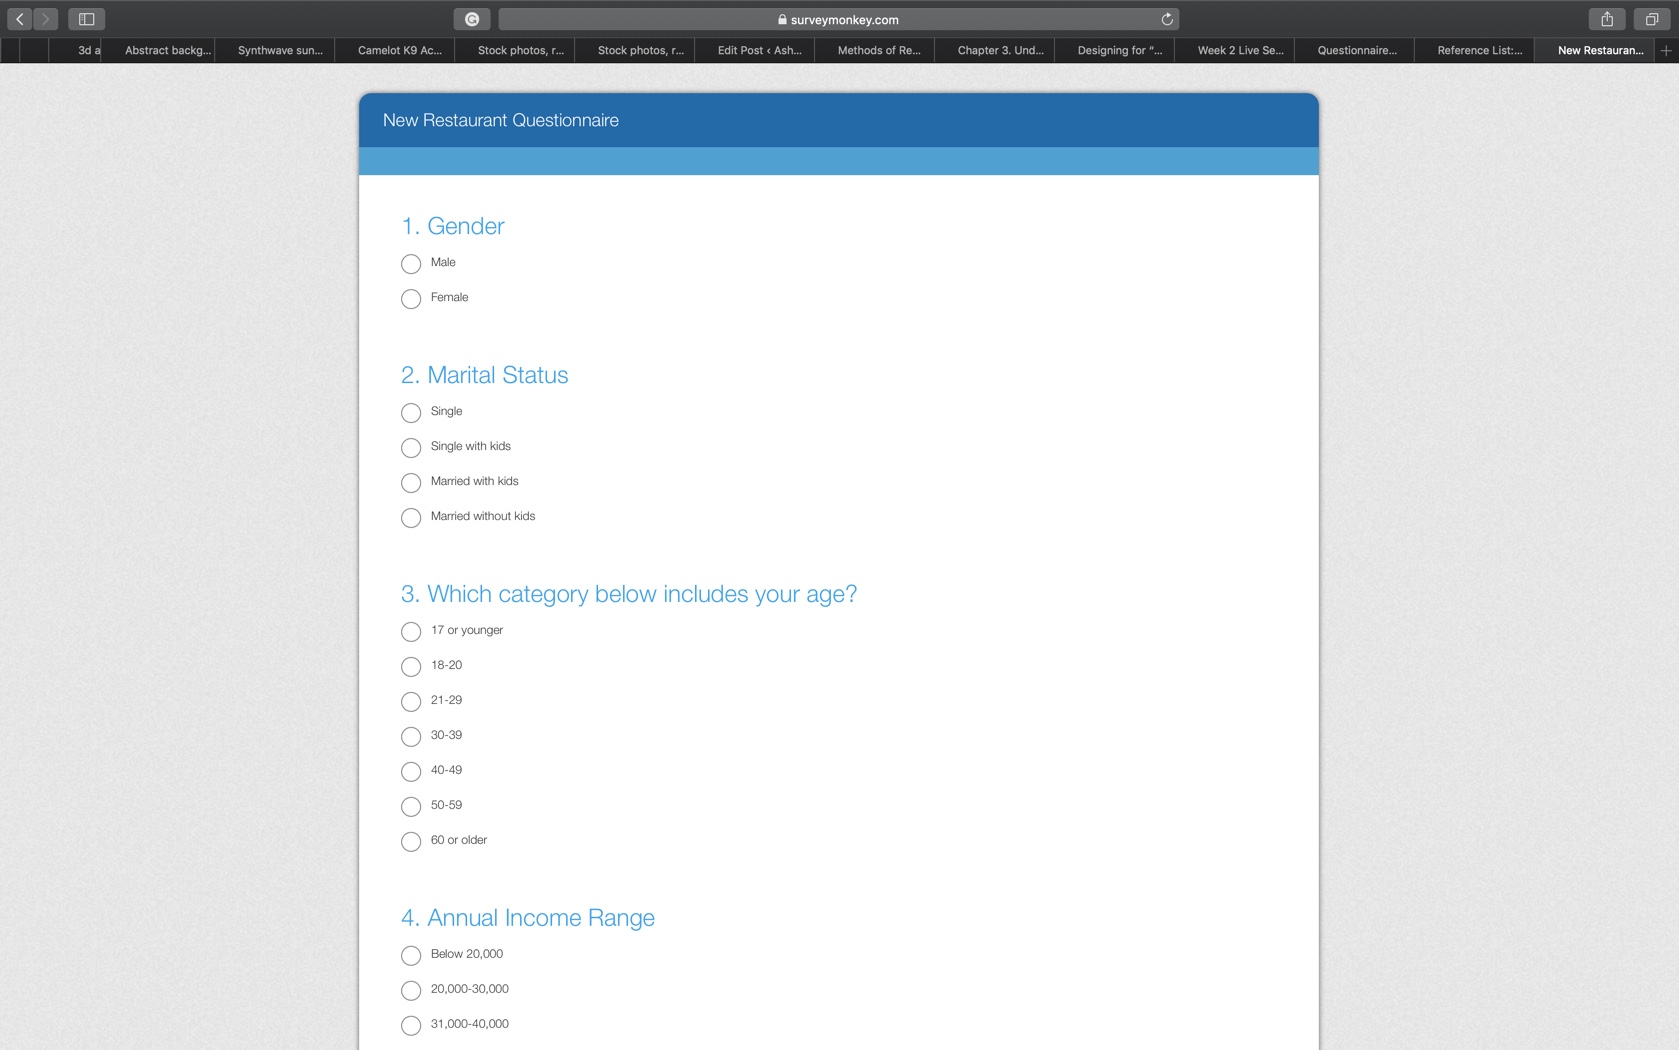
For a college student completing a project, Google Forms provides the most affordable option for testing because it’s free! It not only allowed me to put pictures with each quesiton, but I customized the survey to reflect the brand’s color palette and even chose the type that was used. As the Pew Research Center (n.d.) notes, researchers sometimes put out open-ended question surveys to find common answers and use the responses to create close-ended questions to put out the survey again.
If that was something I had time for, Google Forms would be the best way to run that preliminary questionnaire and then, if I had allocated funds, I could use Survey Monkey to utilize the industry-standard testing site. Admittedly, the one thing, I would have liked to include was an additional text box with each question in my Google Forms questionnaire to allow participants to add their personal thoughts (which Survey Monkey allows) but I had to make do with what I had. Another plus in Google Forms’ favor is that there is no limit (as far as I know) to how many participants took my questionnaire. Survey Monkey stops providing responses for survey participants after 42 or 43 people have completed it unless you upgrade to one of their paid subscriptions. Again, when I have funds provided to me by clients this will no longer be an issue, until then I’ll stick with Google Forms.
Acquiring Competencies
Academic
- Hierarchy of User Needs (Conceptual): Understanding this concept will create more focused and pleasing designs as its sole purpose to appeal to what users find valuable about the project.
- Hard Values (Conceptual): Being able to identify how your project can show tangible and concrete benefits is imperative, especially in a freelance position or agency, to stand out to clients. This is sometimes harder to do than I thought it would be, but I having created projects with others that saved them money is probably my closest example.
- Soft Values (Conceptual): However, it is just as important to provide a service that elicits an emotional connection that is subjective and intangible. A big part of my designs rest on creating emotional connection, whether good or bad.
- Surveys & Quesitonnaires (Technical): Using these techniques has helped me understand how to reach the targeted audience in an easy and accessible way. It was not as nerve-wrecking or soul crushing as I thought it would be to have someone evaluate my designs.
- Models of Design Education (Conceptual): In today’s world, designers are not limited to one box. We are being trained to be Jacks-of-all-trades and I love knowing how to do little bits of many things. I do recognize that it would be helpful to have at least one or two skillsets that I am well versed in so I have a grounding skill to branch out from.
- Design Thinking (Conceptual/Technical): This is both technical and conceptual because of the results that come from design thinking. When starting a project, I may start by sketching then do research or vise versa. There are so many moving parts to design thinking and how it drives our process that it takes on many forms.
Occupational
- Adobe Spark (Technical): For social media purposes, this platform allows for an easy transition between Adobe Stock and the project. It’s ease of use makes it valuable for creating projects such as infographics
- Research (Technical): Conducting research, whether its qualitative or quantitative, requires a curiosity and drive to finding and sharing the answers, even when the results are not what you thought they would be or might want them to be. With my background being in Psychology, I love conducting research that explores both the quantitative and qualitative (mixed method) of a study. I think having both helps create the fullest picture and can start to explain the ‘why’ of things.
- Case Study (Technical): Completing a case study has helped to look closer at the project and find its hard and soft values. This is how designers can learn from any possible missteps and realign their approach from project-to-project or even while they’re still working on a project.
- Evaluating design (Technical): Taking the time to have the end user evaluate a design, preferrably before the project is finished, can not only save time and money but can strengthen brand loyalty. It is so helpful to have an idea or direction to go in and keeps designers on track to creating a project with the most value.
- Design Staircase (Conceptual): This concept also focuses on providing value but focuses more on how a company integrates design into its business model. Finding a company that has fully integrated design into its practices would be ideal as it shows their belief and trust in design as an equally important part of their company’s functioning.
- Data Visualization (Conceptual/Technical): Being able to condence complex ideas into visual designs is an important skill these days and understanding the best way to do this is a huge requirement. Having experienced how difficult this can, I feel that strengthening this skill will go a long way towards making me a more diverse designer.
References:
Carlsson, F. (2019, Dec. 2). Designing for “what we don’t know”. Medium. https://medium.com/a-view-from-above/designing-for-what-we-dont-know-6b0e3ea50aef
Coleman, A. (2020). BoxPark Sushi Brand Awareness Questionnaire [Data set]. Google Forms. https://docs.google.com/forms/d/1dBA9VAS0ZSzC5ik6grj2kL0vnaOcoL17oTbXZ4V0jGs/edit#responses
O’Grady, K. & O’Grady, J. V. (2009). Methods of Research (8/10). In K. O’Grady & J. V. O’Grady (Eds.), A designer’s research manual. (pp. 48-49). Rockport Publishers. https://learning.oreilly.com/library/view/a-designers-research/9781592535576/chapter-16.html
O’Grady, J. V. & O’Grady, K. V. (2013). Design Currency: Understand, define, and promote the value of your design work. New Riders. https://learning.oreilly.com/library/view/design-currency-understand/9780133052862/ch01.html
Pew Research Center. (n.d.). Questionnaire design. https://www.pewresearch.org/methods/u-s-survey-research/questionnaire-design/

One thought on “Month 10: Measuring Design Effectiveness”